
Financial Tools for Decision-Making
Net Present Value (NPV) compares future benefits with current costs.
A construction firm evaluates whether rental income from apartments will justify today’s construction costs.
- Cost of construction today = $10,000
- Rental income per year = $3,000
- Project duration = 4 years
- Discount rate = 10%
Step 1: Calculate Discount Factors
| Year | 1 | 2 | 3 | 4 |
| Discount Factor | 0.91 | 0.83 | 0.75 | 0.68 |
Step 2: Benefits (Rental Income)
| Year | Rental Income ($) | Discount Factor | Discounted Rental Income ($) |
| 1 | 3,000 | 0.91 | 2,730 |
| 2 | 3,000 | 0.83 | 2,490 |
| 3 | 3,000 | 0.75 | 2,250 |
| 4 | 3,000 | 0.68 | 2,040 |
| Total | 12,000 | – | 9,510 |
Step 3: Costs (Construction Cost)
| Year | Construction Cost ($) | Discount Factor | Discounted Cost ($) |
| 0 | 10,000 | 1.00 | 10,000 |
Step 4: NPV Calculation
NPV = Total Discounted Benefits−Discounted Cost
= 9,510−10,000
= −490
Step 5: Interpretation
- NPV = – 490 (negative)
- The project’s discounted rental income does not fully cover the construction cost
- The project is not financially viable
Return on Investment (ROI): ROI measures how much profit or benefit a project generates compared to its cost.
If $40,000 spent on marketing generates $60,000 in sales, the ROI helps assess project value.
ROI Formula:
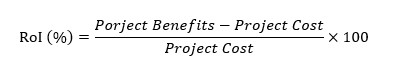
Example
A project:
- Total cost = $20,000
- Total benefit (profit/savings) = $30,000

ROI = 50%
Payback Period shows how quickly investment is recovered.
Solar panel projects often recover costs within a few years due to reduced electricity bills.
Project Details
- Initial cost of solar panel installation = $6,000
- Savings on electricity bills per year = $1,500
| Year | Annual Savings ($) | Cumulative Savings ($) |
| 0 | –6,000 (cost) | –6,000 |
| 1 | +1,500 | –4,500 |
| 2 | +1,500 | –3,000 |
| 3 | +1,500 | –1,500 |
| 4 | +1,500 | 0 (final) |
Calculation:

Payback Period = 4 years.
Weighted Scoring Models: Fair Comparison
A weighted scoring model compares projects using multiple criteria such as cost, risk, and benefits.
A family choosing between Sydney, Gold Coast, and Kakadu scores destinations based on cost, weather, safety, and activities.
| Criteria | Weight |
| Cost | 30% |
| Weather | 25% |
| Safety | 20% |
| Activities | 25% |
| Total | 100% |
Weight table
| Destination | Cost | Weather | Safety | Activities |
| Sydney | 70 | 80 | 90 | 85 |
| Gold Coast | 80 | 75 | 85 | 70 |
| Kakadu | 60 | 90 | 80 | 95 |
Score Table
Calculate weighted scores:
Multiply each score by its weight (in decimal):
Sydney:
- Cost: 70 × 0.3 = 21
- Weather: 80 × 0.25 = 20
- Safety: 90 × 0.2 = 18
- Activities: 85 × 0.25 = 21.25
- Total = 21 + 20 + 18 + 21.25 = 80.25
Gold Coast:
- Cost: 80 × 0.3 = 24
- Weather: 75 × 0.25 = 18.75
- Safety: 85 × 0.2 = 17
- Activities: 70 × 0.25 = 17.5
- Total = 77.25
Kakadu:
- Cost: 60 × 0.3 = 18
- Weather: 90 × 0.25 = 22.5
- Safety: 80 × 0.2 = 16
- Activities: 95 × 0.25 = 23.75
- Total = 80.25
Weighted Score Table
| Destination | Cost (30%) | Weather (25%) | Safety (20%) | Activities (25%) | Weighted Score |
| Sydney | 70 | 80 | 90 | 85 | 80.25 |
| Gold Coast | 80 | 75 | 85 | 70 | 77.25 |
| Kakadu | 60 | 90 | 80 | 95 | 80.25 |
0 20 40 60 80 100
Sydney ██████████████████████ 80.25
Gold Coast █████████████████ 77.25
Kakadu ██████████████████████ 80.25
Conclusion
Financial tools play a vital role in effective decision-making by helping individuals and organizations evaluate the feasibility and value of projects. Net Present Value (NPV) provides insight into whether future benefits justify current costs by considering the time value of money. In the example, the negative NPV indicated that the construction project was not financially viable. Return on Investment (ROI) offers a clear measure of profitability, allowing decision-makers to compare benefits against costs easily. The payback period highlights how quickly an initial investment can be recovered, which is especially useful for assessing risk and liquidity.
In addition to financial measures, weighted scoring models support fair and balanced decisions by incorporating both quantitative and qualitative factors such as cost, safety, and overall benefits. By combining financial analysis with multi-criteria evaluation, decision-makers can make more informed, transparent, and rational choices. Together, these tools ensure that resources are allocated efficiently and projects selected align with financial goals and broader priorities.